Deviation Analysis Using LiDAR: How Industrial Leaders Reduce Risk

By
Kyle Cooper
January 29, 2026
8
min read
UI

Deviation Analysis: Why Industry Leaders Are Moving Beyond Surveys

In industrial environments, small movement creates big consequences. A few millimeters of foundation settlement. A pipe rack drifting out of tolerance. Thermal expansion that no longer behaves the way it did on paper.

Most failures don’t come from lack of engineering—they come from lack of visibility.

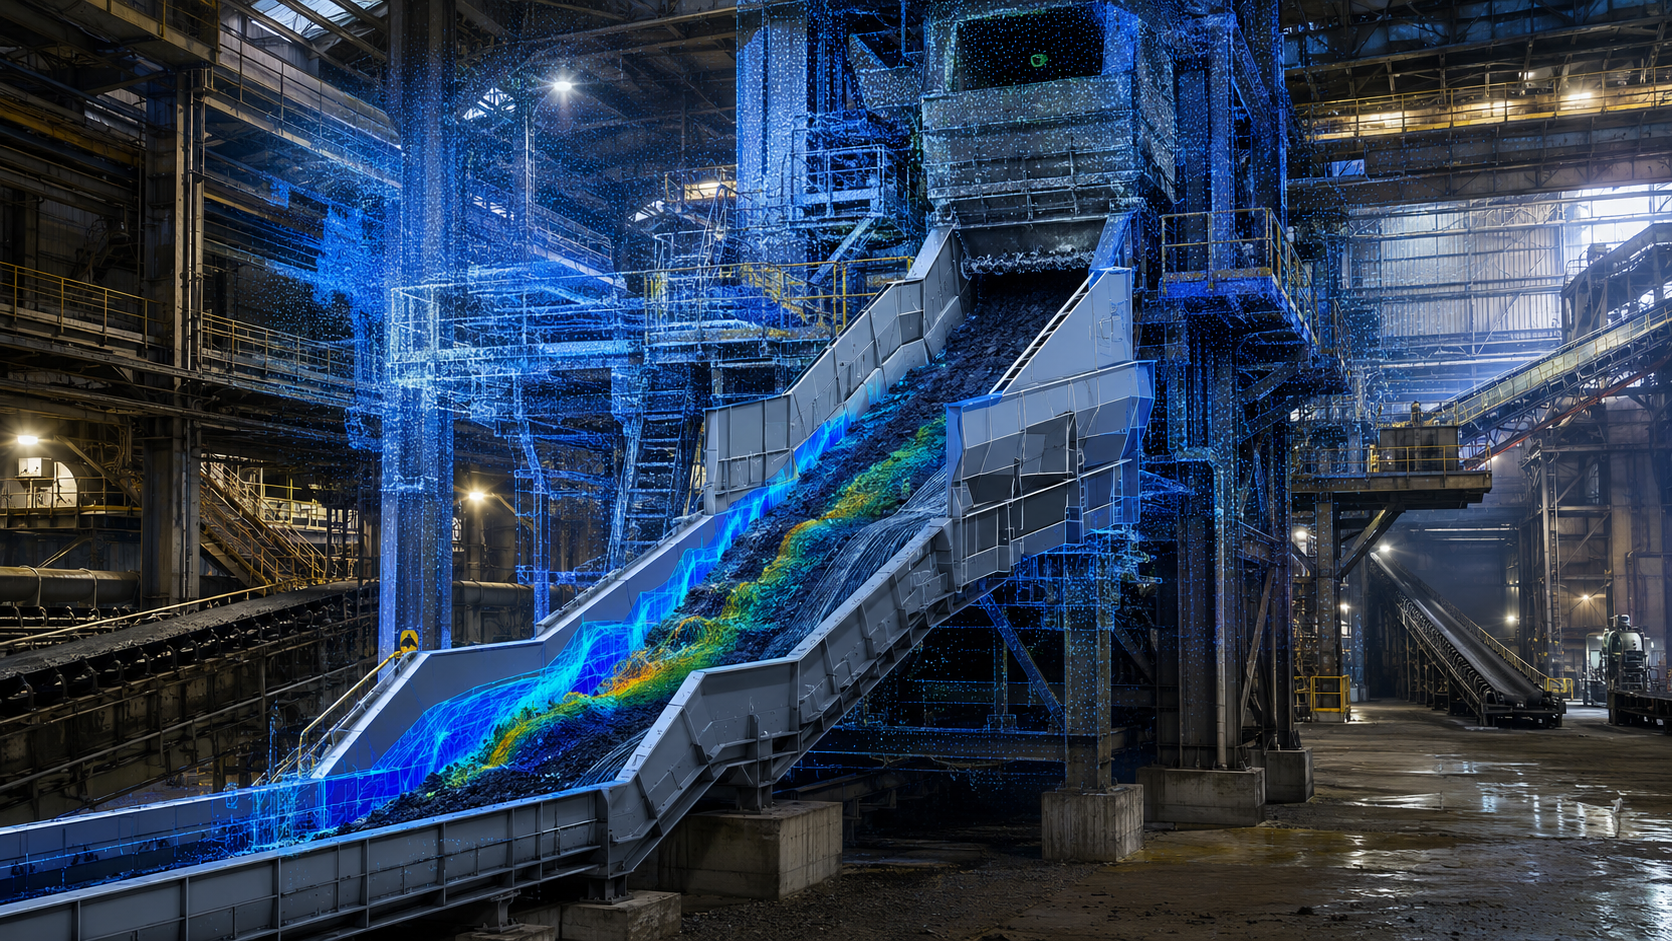
Scan-based deviation analysis replaces assumptions with measurable reality. It allows owners, engineers, and operators to see, quantify, and trend how facilities actually change over time—across millions of data points, not a few survey shots.

At AsBuilt3D, deviation analysis has become one of our most trusted services for power generation, utilities, and heavy industrial clients because it directly answers the question that matters most: What is really happening at my site—and how fast is it changing?

What Makes Scan-Based Deviation Analysis Different?

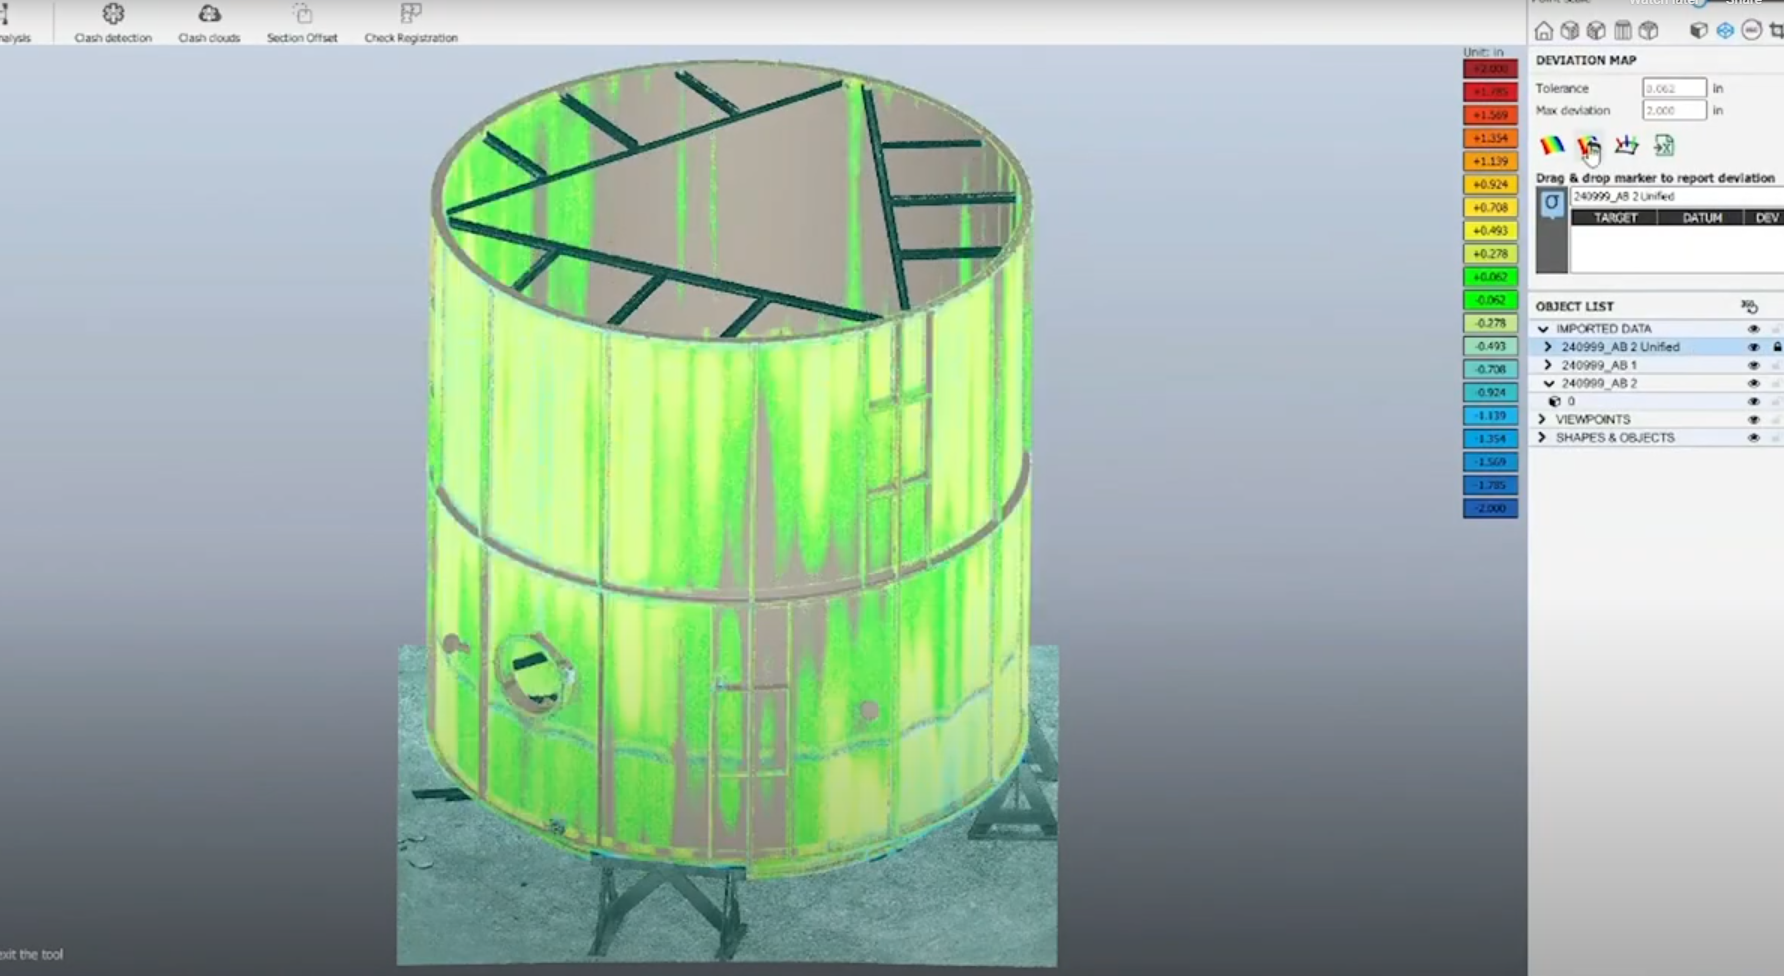
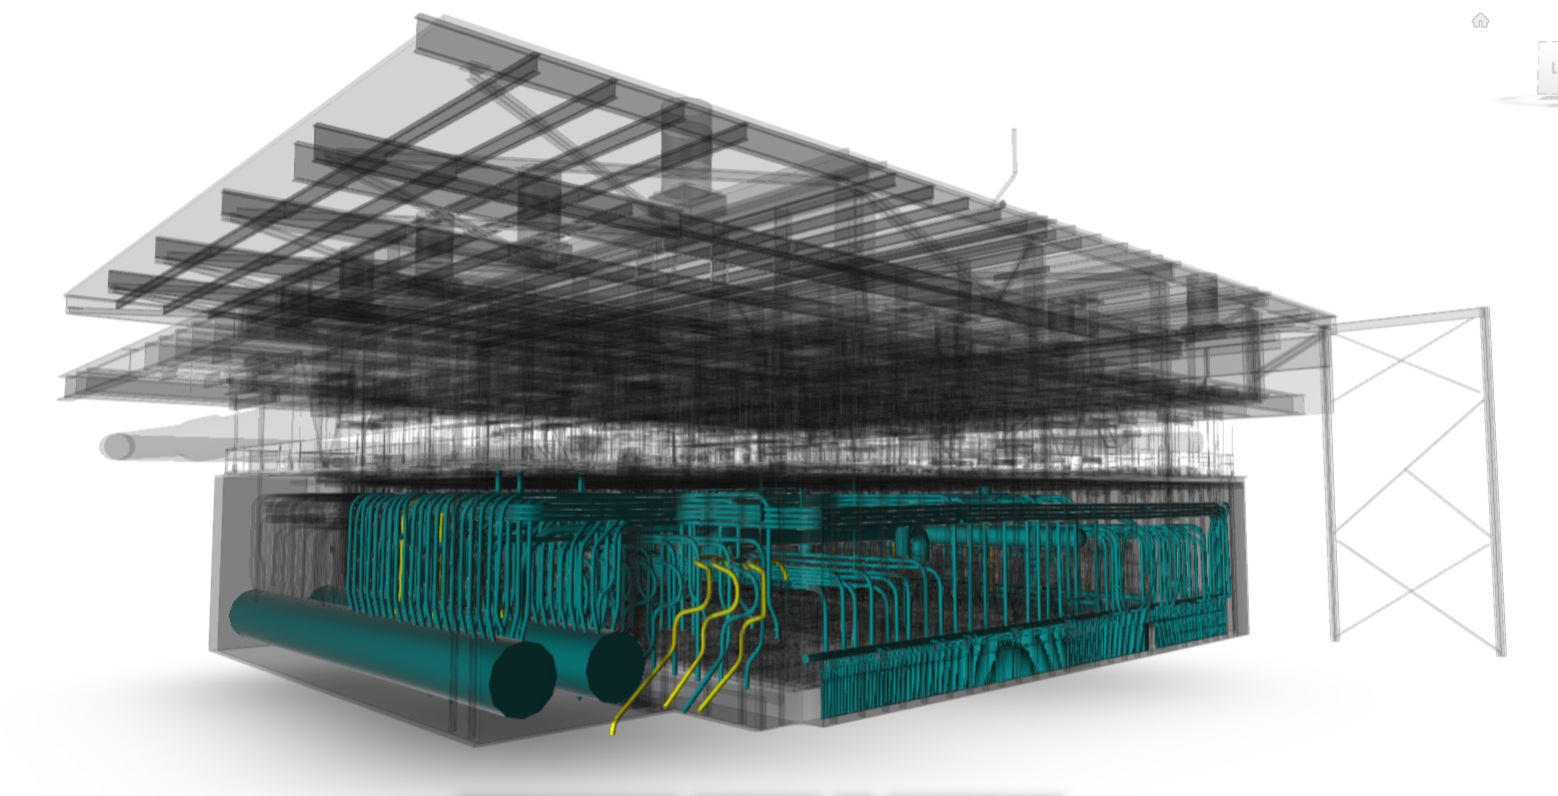
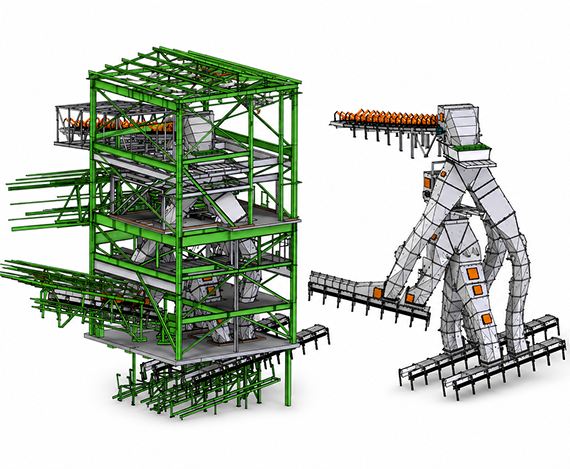
Watch: AsBuilt's Fabrication Inspection Service using deviation analysis to analyze the design to the fabricated end result.

Traditional surveys answer where a few points are. Deviation analysis answers how the entire facility behaves.

Using high-resolution LiDAR reality capture, we:

  • Capture millions to billions of spatial measurements
  • Align scans across time, temperature, or load conditions
  • Quantify true 3D movement, deflection, and deformation
  • Visualize deviation with intuitive color mapping and sections

This density matters. Movement in industrial environments is rarely uniform. When only 20–30 points are monitored, the most critical behavior often occurs between them.

Why Deviation Analysis Has Become Mission-Critical in Energy & Utilities

Across power plants, substations, and industrial campuses, we consistently see the same pressures:

  • Aging infrastructure under increasing load
  • New equipment added to legacy foundations
  • Thermal cycling beyond original design assumptions
  • Regulatory scrutiny around structural integrity and safety

Deviation analysis provides defensible, repeatable evidence to manage those risks proactively.

The AsBuilt3D Method: How We Perform Industry-Leading Deviation Analysis

1. Purpose-Driven Reality Capture

We don’t just “scan everything.” Each scan is designed around:

  • Known risk areas
  • Suspected movement mechanisms
  • Future comparison requirements

Whether it’s a baseline scan, hot vs. cold analysis, or quarterly monitoring, capture strategy is what determines value.

2. High-Fidelity Registration & Control

Deviation analysis is only as good as registration accuracy. We:

  • Use robust control strategies
  • Validate alignment statistically
  • Eliminate noise before comparison

This ensures detected movement is real—not registration artifact.

3. Scan-to-Scan & Scan-to-Model Comparison

Depending on objectives, we compare:

  • Time-separated scans (settlement, creep, drift)
  • Seasonal scans (thermal expansion/contraction)
  • Scans against design or retrofit models

Each comparison answers a different engineering question.

4. Engineering Interpretation (Not Just Visualization)

Color maps alone don’t make decisions. We translate deviation results into:

  • Magnitude + direction of movement
  • Acceleration or stabilization trends
  • Impact to connected systems

This is where experience matters.

Many operation and site leader implement our Mangement of Change services that includes perioditic scans so that an as-built 3D model is always on file for virtual tours, virtual measurements, source file to provide on-demand 2D drawings, and accurate data for capital project planning.

Use Case #1: Ground Settling at a New England Power Facility

Bulk Material Storage – LB Industrial Systems

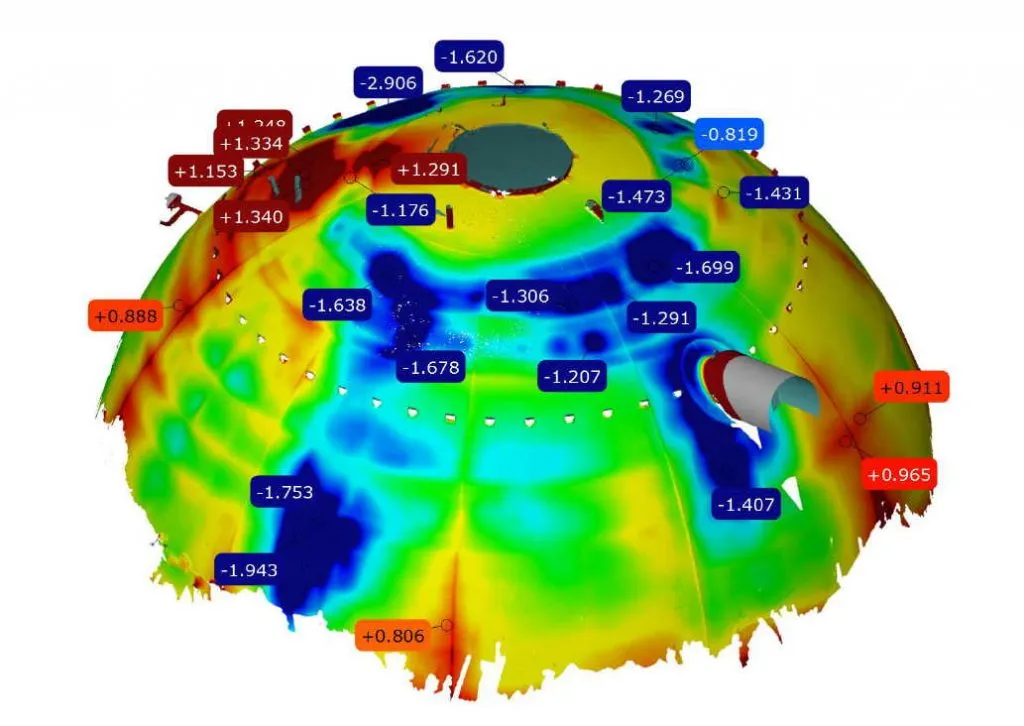
A newly constructed bulk storage unit at a power plant in the New Englind area began showing signs of distress from unplanned settling.

The Limitation of Surveys

  • Quarterly surveys monitored 22 discrete points
  • Results showed movement—but lacked spatial context
  • Engineers couldn’t confidently correlate settlement to structure behavior

Meanwhile, reinforcement work was already underway, increasing load on the foundation and only serving as a band aid until a proper long-term fix could be planned and implemented.

What Deviation Analysis Revealed

By scanning:

  • The building
  • Adjacent structures
  • Surrounding terrain

We uncovered:

  • Differential settlement patterns across the slab
  • Secondary deformation in framing members
  • What ecatly needed to be done to prevent the building's structual integrity from failing

Instead of debating survey numbers, the team now had facility-wide evidence and accurate as-built drawings, 3D model of the envionrment, and a baseline data set to monitor future site changes from settling and other factors.

Use Case #2: Thermal Expansion & Weld Failures in New York

https://www.researchgate.net/publication/313541120/figure/fig4/AS%3A464590954864642%401487778523929/Girth-weld-failure-on-a-pipeline-due-to-welding-quality-issue-and-external-loading.png
https://miro.medium.com/1%2ACKe3ULlfavvQ12wdu6Q_-g.jpeg

A New York power plant was experiencing recurring weld failures—particularly during seasonal transitions.

The Challenge

  • Summer vs. winter temperature swings
  • New equipment altering load paths
  • Retrofit projects stacking assumptions

Failures were being repaired—but not prevented.

Hot vs. Cold Deviation Analysis

We implemented quarterly scans, capturing:

  • Cold-condition geometry
  • Hot-operation geometry

Deviation analysis revealed:

  • Which pipe runs expanded most aggressively
  • Where constraints were unintentionally locking movement
  • Which systems were approaching critical thresholds

This allowed the plant to:

  • Prioritize retrofits where risk was highest
  • Defer non-critical work with confidence
  • Reduce emergency welding events

Additional High-Value Applications of Deviation Analysis

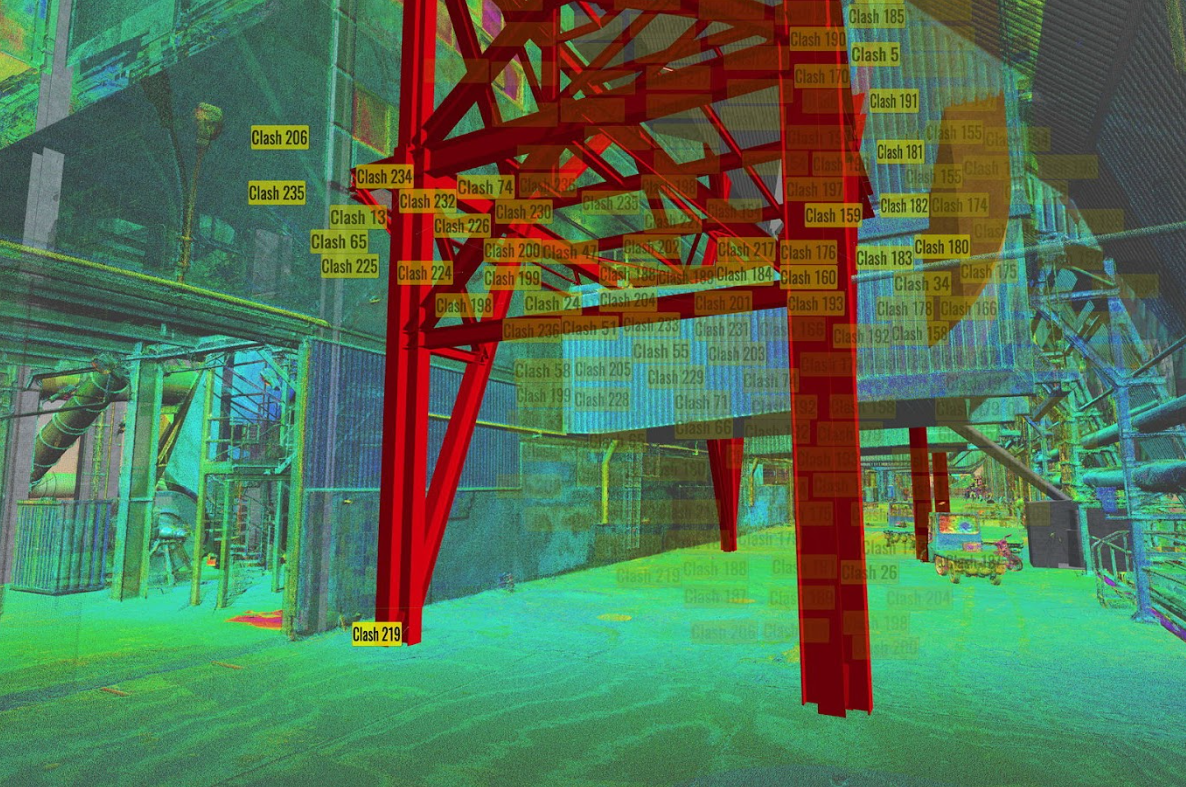
Deviation analysis is routinely applied to:

1. Structural Steel Monitoring

  • Detect column drift
  • Monitor long-span deflection
  • Validate load redistribution after modifications

2. Equipment Alignment

  • Turbine and pump base movement
  • Skid settlement
  • Rail and conveyor alignment

3. Brownfield Expansion Risk Reduction

  • Measure how existing assets respond to new loads
  • Validate construction impact on adjacent systems

4. Regulatory & Insurance Documentation

  • Create defensible records of condition over time
  • Support engineering sign-off and audits

Learn about our fabrication and installation vericiation serivce that inlcudes anlyzing original CAD models to the reality capture of the fabricated or installed equipment.

The Financial Case: Why Deviation Analysis Pays for Itself

Deviation analysis is often viewed as an “advanced” service—until the math is done.

Example: Weld Failure Avoidance

  • Emergency pipe weld repair: $50k–$150k per event
  • Unplanned outage impact: six to seven figures in lost generation
  • Annual deviation monitoring program: a fraction of one failure

By identifying movement before failure, plants shift from emergency response to planned intervention.

Example: Overbuilt vs. Targeted Reinforcement

Without deviation data, engineers often design conservatively:

  • Larger foundations
  • More steel
  • Broader scope

Deviation analysis allows:

  • Reinforcement only where movement exists
  • Deferred capital where behavior is stable

We routinely see six-figure savings from avoided overdesign alone.

Hosting & Accessibility: Making Data Usable

All deviation analysis results are hosted in our secure private data environment:

  • No CAD licenses required
  • No high-end local hardware
  • No approval process through IT
  • Accessible via standard web browser

Heavy computation stays on our infrastructure. Stakeholders simply log in, review, and collaborate.

Why Industry Leaders Adopt Deviation Analysis Early

The most sophisticated operators don’t wait for failure. They monitor behavior.

Deviation analysis enables:

  • Evidence-based capital planning
  • Reduced operational surprises
  • Faster engineering consensus
  • Stronger regulatory confidence

It becomes part of how facilities think—not just how they react.

Replace Assumptions with Measured Reality

Contact Us | AsBuilt 3D

See Your Facility the Way Physics Sees It

If your site relies on limited survey points to manage complex movement, you’re making critical decisions with incomplete information.

Scan-based deviation analysis gives you:

  • Complete spatial truth
  • Repeatable measurement
  • Defensible insight

Talk with AsBuilt3D about establishing a baseline scan or implementing a recurring deviation analysis program tailored to your facility’s risk profile.

Kyle Cooper, AsBuilt
Kyle Cooper
CRO, AsBuilt 3D
Blog

Built on precision and data

Each project represents our commitment to accuracy and technical excellence

Talk with an AsBuilt Engineer

Talk with our team about your facility, scope, and objectives to determine the right capture, modeling, and analysis approach.